Updated May 15, 2024
The Society of Critical Care Medicine (SCCM) represents more than 17,000 highly trained professionals in more than 80 countries who provide care in specialized units and work toward the best possible outcomes for all critically ill and injured patients. SCCM maintains that multidisciplinary care teams led by intensivists (physicians trained and credentialed in critical care medicine) are essential to critical care delivery, improve conditions for healthcare professionals, and boost hospitals’ financial performance. This guide provides statistics on many of the current issues in critical care in the United States. It is intended to be used as a reference in efforts such as advocacy, public relations, and general education.
The impact of critical care medicine and the provision of care in intensive care units (ICUs) on the overall cost of healthcare in the United States is substantial. Between 2000 and 2010, the annual costs of critical care medicine increased 92%, from $56.6 billion to $108 billion. The 2010 cost represents 13.2% of hospital costs, 4.1% of national health expenditures, and $0.72 of gross domestic product. ICU costs per day in 2010 were estimated to be $4300, a 61% increase since the 2000 cost per day of $2669. More recently published data on critical care costs are unavailable in the literature. However, the Centers for Disease Control and Prevention (CDC) reported total national healthcare expenditures for the United States on the order of $3,453 billion in 2019. Additionally, national healthcare expenditures for 2022 to 2031 were projected to grow at an annual rate of 5.4%, accounting for roughly 20% of the economy by the end of that period.
Possible Cost Savings
Cost savings of up to $1 billion per quality-adjusted life-year can be attained with critical care management of severe sepsis, acute respiratory failure, and general critical care interventions. The use of 24-hour intensivist staffing has several advantages, including decreased costs, clinician burnout, mortality, complications, and hospital length of stay (LOS); and improved physician satisfaction. However, most studies regarding the benefits of 24/7 intensivist staffing were conducted primarily at tertiary or academic centers with high patient acuity and volume.
Up to $13 million in annual hospital cost savings can be realized when care is delivered by an intensivist-directed multidisciplinary team. For example, one community hospital achieved a 105% return on investment by implementing mandatory intensivist consultation and admission standards, thereby reducing ICU LOS, ventilator-associated events, and central venous access device infection rates.
Hospitals without on-site intensivists may benefit from telemedicine or tele-ICU services, in which sophisticated electronic systems connect ICU patient data to intensivists in remote locations. The intensivists provide real-time monitoring, diagnostic, and intervention services and work with bedside staff. Telemedicine intensivists also interact with patients and their family members.
In selected settings, tele-ICU care has demonstrated shorter ICU LOS and lower ICU mortality, which may translate into lower hospital costs and better use of resources. A systematic review and meta-analysis of 19 ICU telemedicine studies concluded that tele-ICU programs were associated with reductions in ICU and hospital mortality and ICU LOS but not in hospital LOS and were costly to implement. An Emory Critical Care Center study showed that implementing an advanced practice provider (APP) residency program and tele-ICU staffed with critical care nurses and consultant intensivists resulted in a $4.6 million cost savings.
Sources:
More than 5 million patients are admitted annually to U.S. ICUs for intensive or invasive monitoring; support of airway, breathing, or circulation; stabilization of acute or life-threatening medical problems; comprehensive management of injury and/or illness; and maximization of comfort for dying patients. ICU patients are a heterogeneous population, but all share the need for frequent assessment and a greater need for clinical expertise and technological support than patients admitted to non-ICU beds.
Adult: Cardiac, respiratory, and neurologic conditions are common in adult ICU patients.
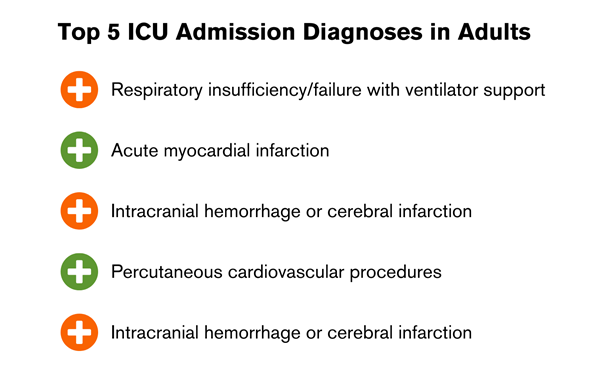
Other conditions and procedures involving high ICU use are:
The most common technological support is mechanical ventilation, required by 20% to 40% of U.S. ICU admissions.
Pediatric: Patients admitted to the pediatric ICU (PICU) may have either acute illness or acute exacerbations of complex chronic conditions. Many PICUs provide care for cardiac diagnoses; however, many larger pediatric centers have developed separate cardiac ICU and PICU programs. The proportion of children admitted to PICUs in children’s hospitals increased from 51% in 2001 to 85% in 2019. Respiratory illnesses remain the most common diagnoses, making up more than 30% of PICU admissions in 2019. The second most common diagnoses are injury and poisoning (15%).
The median age of children admitted to the PICU is 4 years (IQR 0-12). The presence of a comorbidity on PICU admission has been increasing since 2001 (46%) to 2019 (57%), along with an increase in technology dependence on PICU admission from 16% to 23%. LOS is greater than 7 days in more than 35% to 40% of admitted patients, and more than 40% of patients admitted to the PICU have respiratory failure on admission.
Other common organ failures on PICU admission are cardiac (20%) and neurologic (17%). The proportion of patients with multiorgan dysfunction on PICU admission has increased from 7% in 2001 to 21% in 2019. Severe sepsis and septic shock are also common in PICUs, with a prevalence of more than 8% worldwide and a mortality rate of more than 24%.
Neonatal patients admitted to the neonatal ICU (NICU) are born either preterm or at term with serious medical or surgical conditions. The majority of very-low-birth-weight (< 1500 g) newborns are cared for in NICUs, and more than 80% of NICU admissions are very-low-birth-weight. Outcomes are improved for high-risk newborns, especially preterm infants, born in facilities with a NICU, and mortality is lower at higher-volume centers.
Sources:
Data on U.S. ICU facilities are available from two national hospital databases: the American Hospital Association (AHA) Hospital Statistics system and the U.S. Centers for Medicare and Medicaid Services Healthcare Cost Report Information System (HCRIS). AHA offers data on the number of ICU beds and units for adult (medical-surgical, cardiac, and other) and child (pediatric and neonatal) units as well as burn units and observation, step-down, and progressive beds. AHA offers no data on bed utilization. HCRIS offers bed and use data on adult (intensive care, coronary care, surgical/trauma, burn, psychiatric/detoxification) and child (pediatric and neonatal) beds (but not units). HCRIS data include U.S. government-based Medicare and Medicaid use. HCRIS has no data on observation, step-down, or progressive beds.
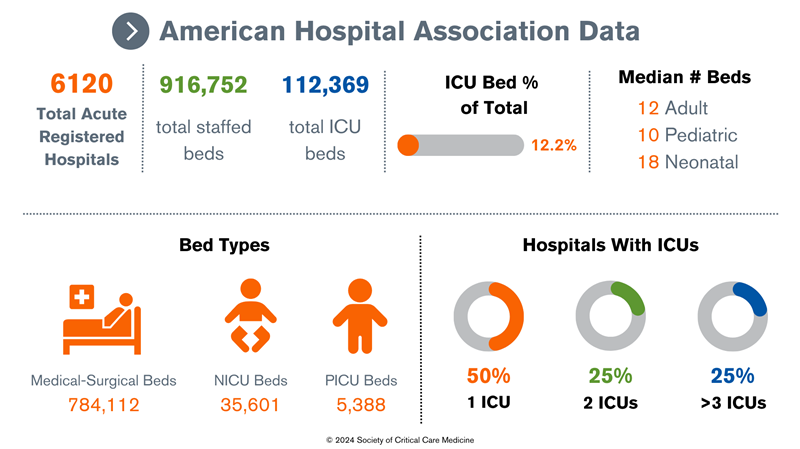
AHA data: According to the AHA 2023 annual survey, the United States had 6120 acute care registered hospitals; 5222 of these had at least 25 acute care beds and at least 1 ICU bed. These hospitals had a total of 916,752 staffed beds and 112,369 ICU beds (12.2% ICU beds/total beds) in more than 5000 ICUs. There were a total of 784,112 medical-surgical beds, including cardiac beds, orthopedic beds, and other beds. There were 5388 total PICU beds reported in 2018, and 35,601 NICU beds reported in a 2023 article. The median number of beds in medical-surgical, cardiac, and other units was 12, with 10 pediatric beds and 18 neonatal beds. More than 50% of hospitals had 1 unit, 25% had 2 units, and 25% had 3 or more units.
Data compiled from AHA Hospital Statistics.
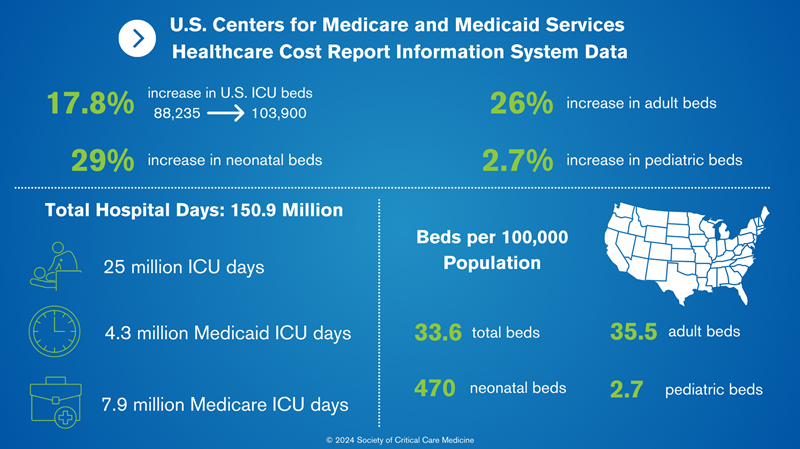
HCRIS data: From 2000 to 2010, the number of critical care beds in the United States increased by 17.8%, from 88,235 to 103,900. However, the majority of the growth in critical care bed supply is occurring in a small number of U.S. regions with large populations, fewer baseline ICUs per 100,000 capita, higher baseline ICU occupancy, and increased market competition. Additionally, between 2000 and 2010, the greatest percentage increases were in neonatal beds (29%), followed by adult beds (26%); there were minimal changes in pediatric beds (2.7%). Of the 103,900 ICU beds in 2010, 83,417 (80.3%) were adult, 1917 (1.8%) were pediatric, and 18,567 (17.9%) were neonatal. In total, there were 33.6 beds/100,000 population, 35.5 beds/100,000 adult beds (age > 18 years), 2.7 beds/100,000 pediatric beds (ages 1-17 years), and 470 beds/100,000 neonatal beds (ages < 1 year).
ICU days: HCRIS analysis showed that there were 150.9 million hospital days, including 25 million ICU days in 2010 (16.5% ICU days/total days). Medicare accounted for 7.9 million ICU days (31.4%) and Medicaid 4.3 million ICU days (17.2%).
Occupancy: Occupancy rates were calculated from HCRIS data (days/possible days). In 2010, hospital and ICU occupancy rates were 64.6% and 68%, respectively. Occupancy rates vary by hospital size, with higher occupancy rates associated with larger hospitals.
Data compiled from various sources.3-5
Sources:
Despite increasing ages and severity of illness of ICU patients, there was a 35% relative decrease in mortality for ICU admissions from 1988 to 2012. The leading causes of death in the ICU are multiorgan failure, cardiovascular failure, and sepsis. Sepsis affects more than 1.7 million people in the United States and is the leading cause of death in U.S. hospitals, accounting for 270,000 deaths annually. It is also the major cause of hospital readmissions within 30 days, costing more than $2 billion annually. Of patients who are diagnosed with sepsis, up to 51% develop acute renal failure and up to 20% have acute respiratory failure requiring mechanical ventilatory support.
More than 75,000 children develop sepsis each year and 6800 of these children die. Sepsis remains the leading cause of death for children worldwide, with 3.4 million lives per year. Thirty-five percent of children hospitalized for septic shock have not regained their prior health-related quality of life 12 months after discharge.
Mortality rates in patients admitted to adult ICUs average 10% to 29%, depending on age, comorbidities, and illness severity. Mortality rates for patients who have been admitted to the ICU is greater for the next 10 years after they leave the ICU compared with patients of the same age who have never been admitted to the ICU.
Despite increasing ages and complexity of PICU patients, overall mortality decreased from 2.5% to 1.8% between 2001 and 2019. Patients with underlying comorbidities have a 10-times higher risk of mortality (3%) than children without underlying comorbidities(0.3%). Multiorgan dysfunction and mechanical ventilation are associated with mortality rates of 7.6% and 8% respectively. Black children in the United States have a higher rate of mortality from sepsis (OR 1.37) than White children.
The American Academy of Pediatrics (AAP) defines a NICU as a facility able to provide newborn care with sustained life support, a full range of respiratory support, access to pediatric medical and surgical specialties, pediatric anesthesiologists, and pediatric ophthalmologists. The AAP defines the NICU in terms of four levels of care with increasing capabilities (level I: well-baby nursery, level 2: special-care nursery, levels III and IV: full ICU care).
Sources:
The multidisciplinary ICU team may consist of critical care nurses, APPs (nurse practitioners [NPs] and physician assistants [PAs]), intensivists, hospitalists, pharmacists, respiratory therapists (RTs), nutritionists, social workers, physical therapists, occupational therapists and other professionals. Challenges exist in defining these groups and obtaining data.
For example, an intensivist can be defined as a physician formally trained in critical care, with or without critical care medicine board certification and working in the ICU with variable time commitments. However, a hospitalist, without formal critical care medicine training, may be privileged to deliver critical care medicine, especially in resource-limited settings. ICU nurses are easily identified; however, the American Association of Critical-Care Nurses (AACN) does not keep a global database.
Similar problems exist in determining total numbers of RTs and pharmacists and those who work primarily in the ICU. Salaries are similarly difficult to determine because they vary greatly by experience, geographical location, type of hospital and work model, and of course public reporting.
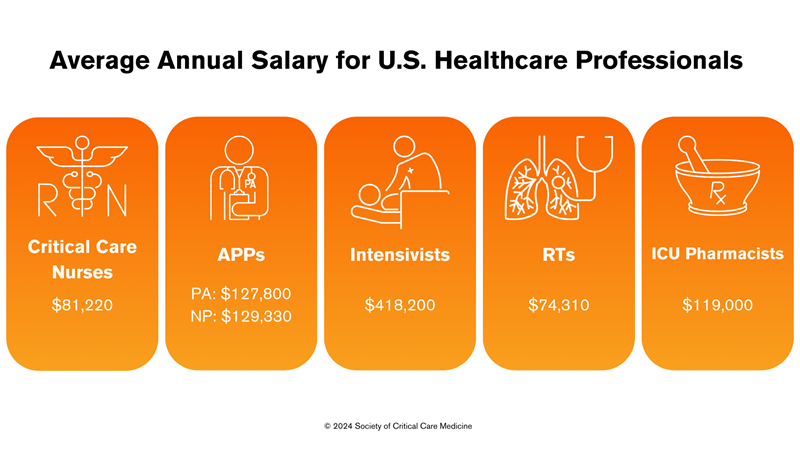
Critical care nurses: There are more than 63,449 ICU nurses currently employed in the United States. The median annual salary for a registered nurse was $ 81,220 per year or $ 39.05 per hour according to a May 2022 report from the U.S. Bureau of Labor Statistics. But, again, these salaries vary widely depending on education, certifications, skills, and number of years spent in the profession.
APPs: Estimates suggest that more than 58,080 acute care NPs and 33,070 PAs practice critical care in the United States. Mean salaries were estimated at $129,330 for acute care NPs, and $127,800 for PAs.
Intensivists: AHA data for 2015 suggested that there were approximately 29,000 privileged intensivists in the United States, accounting for 20,000 full-time-equivalent intensivists. American Medical Group Association physician compensation data shows that median compensation for intensivists in 2021 was $418,200. The Medscape Intensivist Compensation Report 2023 shows this figure as $369,000.
RTs: The most recent (2016) data from the U.S. Bureau of Labor Statistics estimates a national total of 129,910 RTs. Their median salary is $74,310.
ICU pharmacists: There are only 3600 board-certified critical care pharmacists for the 100,000 ICU beds in the United States. Every year, qualified trainees interested in critical care pharmacy residency training go unmatched because there are only 171 accredited residency programs. The median annual salary for ICU pharmacists on Glassdoor.com is $119,000.
Sources:
Three SCCM committees evaluated the critical care field’s continued emergence from the COVID-19 pandemic, as well as changes in the critical care workforce and pitfalls exposed by the pandemic. This update covers critical care training across multiple professions, including physicians, APPs, pharmacists, and RTs. Read the full update here.
Growth in Graduate Medical Education Positions
Data compiled from both the National Residency Match Program and the SF Match have shown increases in programs offering training positions in critical care medicine (Figure 1). The ratio of applicants per position has remained steady across all training programs with the increased number of open positions available, with a higher ratio of applicants per position for newer, stand-alone critical care medicine training programs. According to data from the American Association of Medical Colleges, there has been an overall increase in critical care physicians, from 13,093 in 2020 to 14,159 in 2022. A smaller increase in pediatric critical care physicians occurred in that same time period, from 2639 physicians to 2774.
Figure 1: Comparison of Training Programs Across All Pathways of Critical Care Training
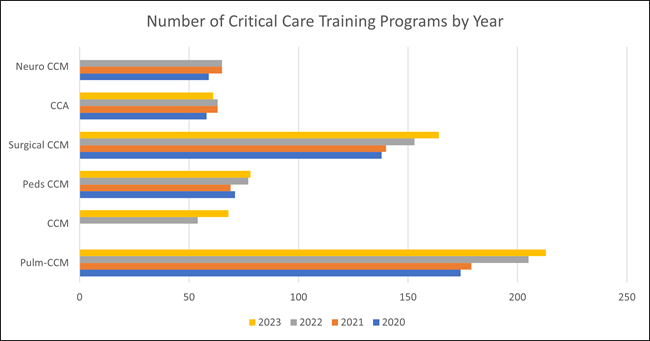
CCA, critical care anesthesiology; CCM, critical care medicine.
Data compiled from National Resident Matching Program and SF Match.
Growth in Critical Care Pharmacy Programs
The American Society of Health-System Pharmacists Resident Matching Program data shows continued growth in available critical care PGY2 programs and positions. In 2019, there were 143 programs with 189 positions available; in 2023 these numbers increased to 173 programs with 223 positions available. Between 2016 and 2020, the number of board-certified critical care pharmacists increased from 532 to 2873. This number is projected to reach nearly 5200 by the year 2025. Despite this consistent growth, the number of board-certified critical care pharmacists remains relatively low when considering the number of ICU beds reported in the United States. While there is a recommended practitioner-to-patient ratio for intensivists (1:14), there is no recommended pharmacist-to-patient ratio, although the consensus is approximately 1:15. Recent surveys have shown that many critical care pharmacists report ratios higher than this, even as high as 1:30.
Growth in Critical Care Advanced Practice Programs
The 2022 Bureau of Labor Statistics has estimated that there are about 30,000 NPs currently practicing in critical care. Approximately 2071 PAs identified their primary practice as critical care medicine and 144 identified it as pediatric critical care medicine. However, this likely underestimates the number due to PAs identifying with their department rather than their practice setting (e.g., surgery or anesthesia). There are a total of 249 accredited advanced practice registered nurse/RN programs, and there are 46 postgraduate NP/PA training programs under the labels of acute care or critical care/emergency medicine. A total of 15 postgraduate clinical programs have been accredited, with two programs specifically in critical care medicine, although the Association of Postgraduate PA Programs lists a total of 16 critical care medicine PA residency programs. A 2021 survey identified 249 PAs who had completed postgraduate training in critical care.
Growth in Respiratory Therapy Programs
It is estimated that 92,474 RTs will leave the field by the year 2030, compounded by the decline in enrollment in RT programs by 27% since 2010 and full enrollment in only 10% of programs. Innovations in mechanical ventilators and investments to improve patient care procedures (e.g., arterial blood gases, aerosol therapy, bronchoscopy) were all reported as vital to the future success and retention of RTs.
Effects of the Pandemic and Burnout on the Critical Care Workforce
During the COVID-19 pandemic, 100,000 nurses left the profession and an estimated 800,000 intend to follow by 2027. A national study of 20,665 U.S. healthcare practitioners found an attrition rate of 2 in 5 for nurses and 1 in 5 for physicians leaving their practice altogether. Turnover was highest among health aides and assistants, followed by licensed practical nurses and licensed vocational nurses. This shortage is especially prevalent in critical care, with an estimated 27% of critical care nurses leaving the profession worldwide, reflected in unstaffed ICU beds, ongoing delays in delivery of patient care, and increased work burden on critical care practitioners. An estimated 35% to 45% of nurses and 40% to 54% of physicians in the United States have burnout, with U.S. intensivists experiencing the highest burnout rates, at 25% to 71%.
Sources:
Thanks to the members of the SCCM Leadership, Empowerment, and Development Committee and the authors of SCCM Critical Care Workforce Update 2023 for updating the information on this page.